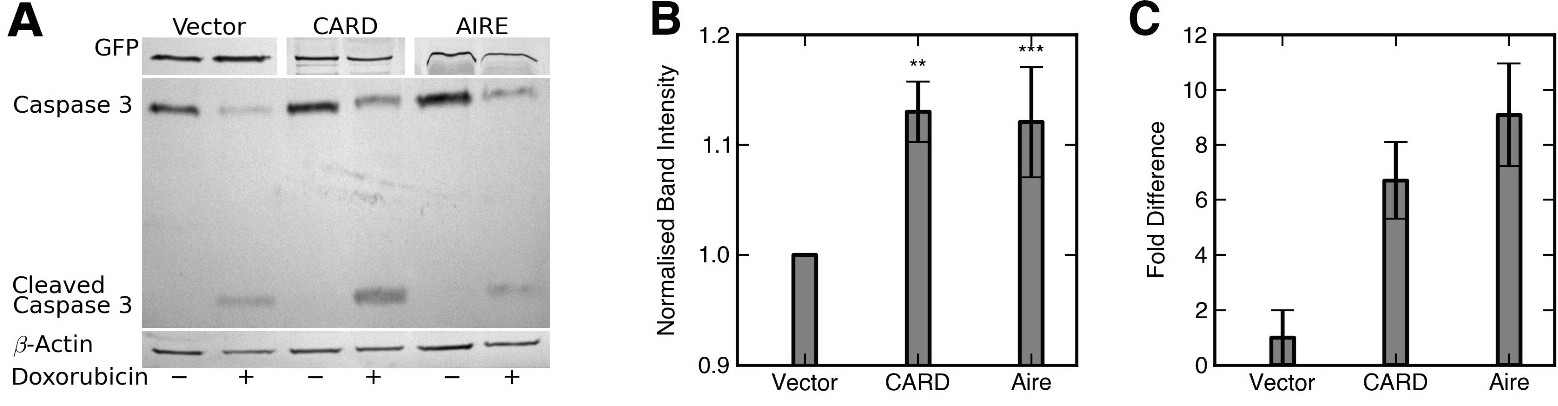
Fig. 8. (A) Representative image of western blot detection of caspase 3 and cleaved caspase 3 in cell lysates of GC1 cells over expressing GFP, CARD, and AIRE full length with and without doxorubicin tretment. (B) Normalised band intensities showing caspase 3 level. Values were calculated from three independent transfection with each set done in duplicates. Band intensities were calculated using Phoretix 1D advanced software and were normalised to beta actin. Stuents t Test showed p<0.05 (CARD) and p< 0.001 (full length AIRE). (C) Quantitative Real time PCR evaluations of caspase-3 levels in GC1 cells transfected with AIRE, CARD and insert less vector. The data shown here is from two independent transfection and each set RT-qPCR done in triplicates and fold change relative to beta actin is represented on log scale.